
The Dashboard (Figure 2) offers a general view of the application environment.
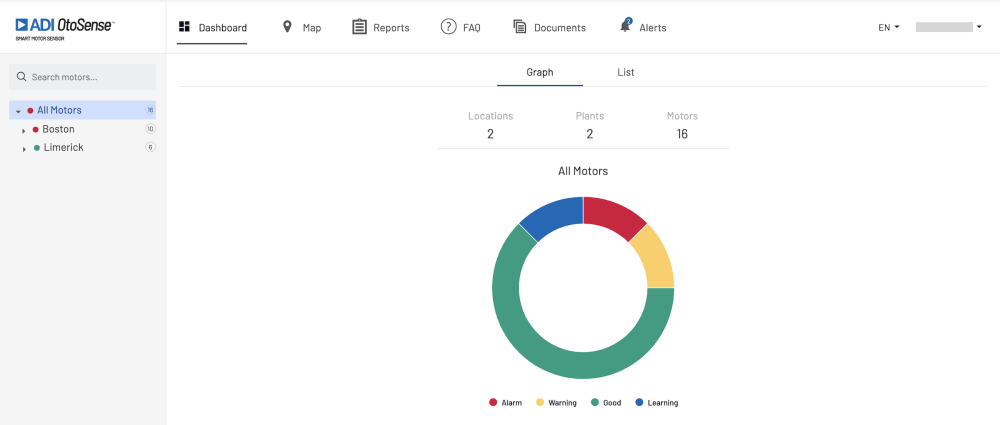
Figure 2. Dashboard – General View
The Dashboard includes a Search Bar (Figure 1a) and a collapsible menu (Figure 1b) that contains a list of all the motors currently being monitored by SMS devices, including city, plant name, process and motor name.
Use the Search Bar to quickly navigate to any of the motors you want to visualize, or start typing for a list of matches.

Figure 1a. Dashboard Search bar
In the collapsible menu, the numerical indicator to the right displays the number of motors being monitored at each level of locations, while the colored dots displays the most relevant status information.
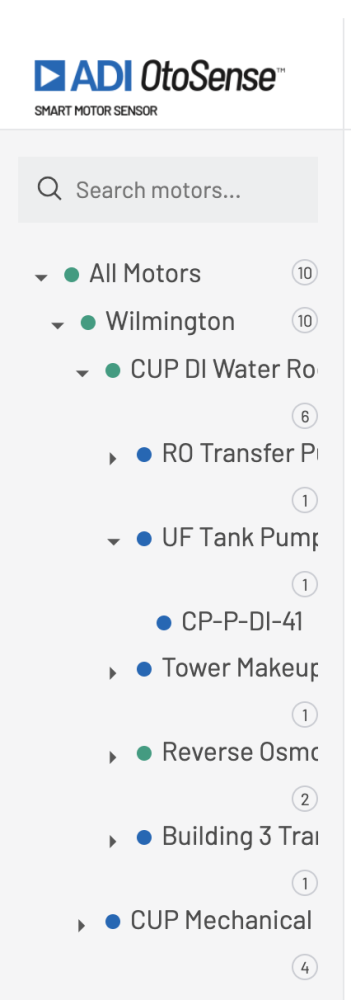
Figure 1b. Collapsible menu
ADI OtoSense uses a color-coded system for information and fault indication:
- Green if no faults have been detected
- Yellow if the SMS device predicts that a fault might occur soon
- Blue if the SMS device is currently performing a learning process
- Red if a fault has been detected on any of the motors installed in that location
- Gray if there is no communication with the device or if the battery is exhausted
The Dashboard presents a useful at-a-glance view in Graph or List (Figures 2a -2b) form so the operator can quickly navigate and visualize any problems detected and react accordingly, should an issue be flagged by the application.
Graph view offers a graphical depiction of the monitoring situation.
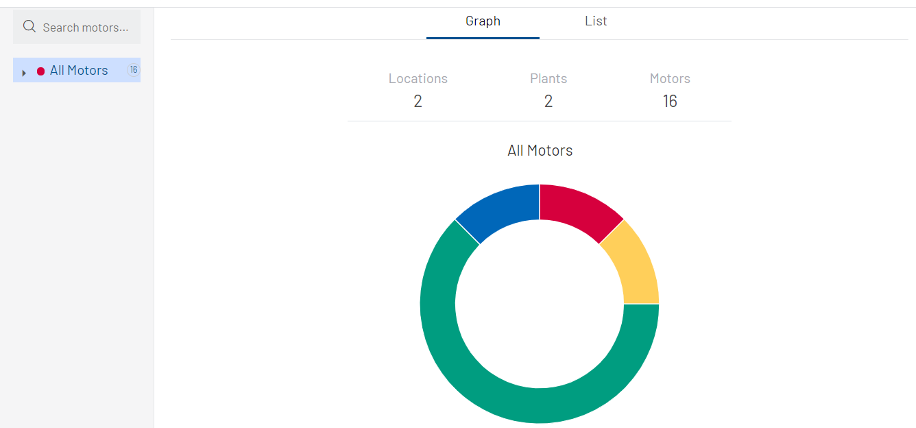
Figure 2a. Dashboard in Graph View
List view offers the same information, but in list form.
Note: Clicking any motor here will take you directly to that motor’s information, see Figure 4 below. You can also search for any motors in your network using the provided Search Bar.
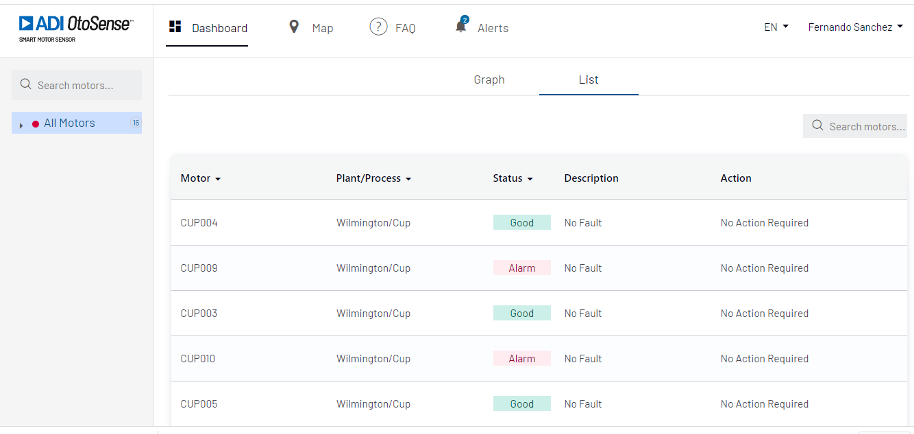
Figure 2b. Dashboard in List View
Note that you can sort the view according to several parameters: Motor, Plant/Process, Status, initial alarm, and repaired/recovered.
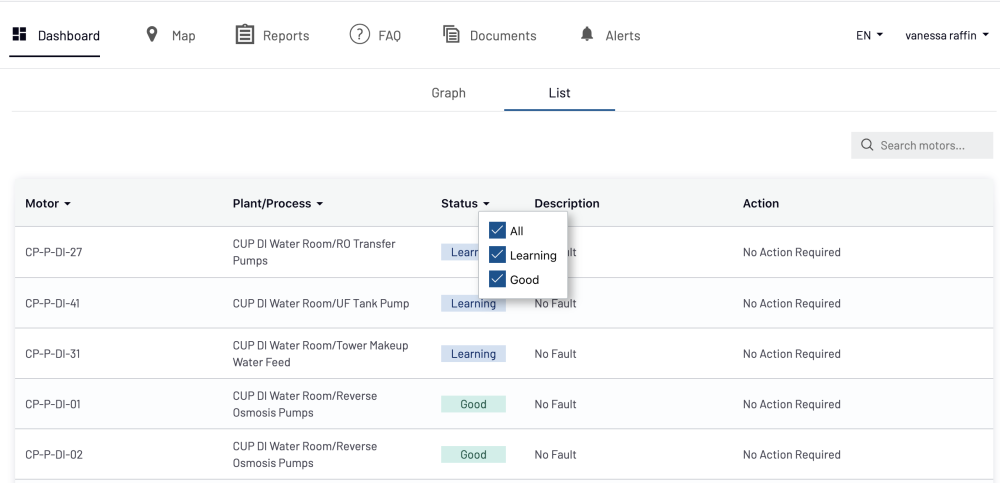
Figure 2c. Dashboard in List View – filters
Click any of the locations to expand it and view the status of the motors installed at that location (Figure 3).
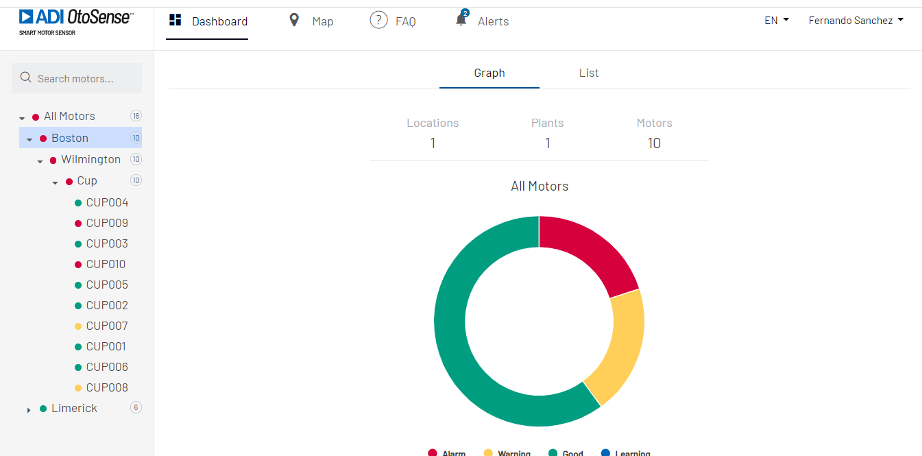
Figure 3. Expanded location view
Click any of the motors to view its operating parameters.
Here (Figure 4), we see that motor CUP009, located at a plant in Wilmington, Boston requires immediate attention as the bearings have failed.
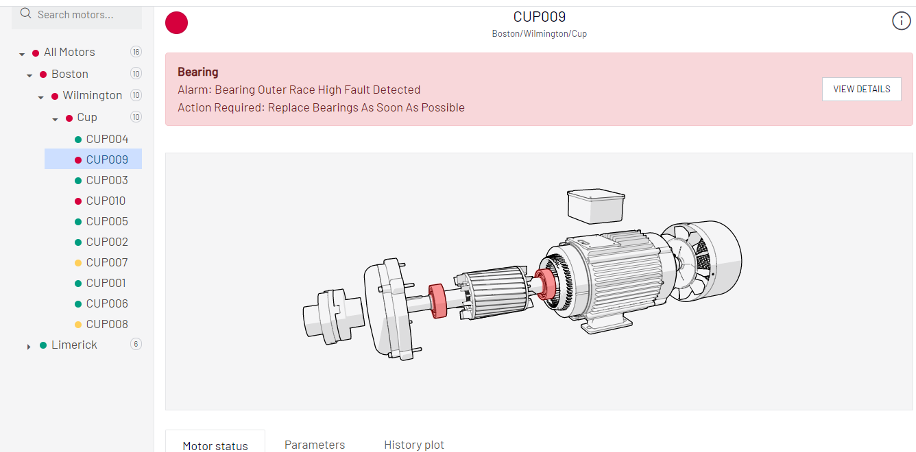
Figure 4 – Detailed motor view
This screen features three tabs for additional information about the motor (Figure 5).
- Motor Status
- Parameters
- History plot
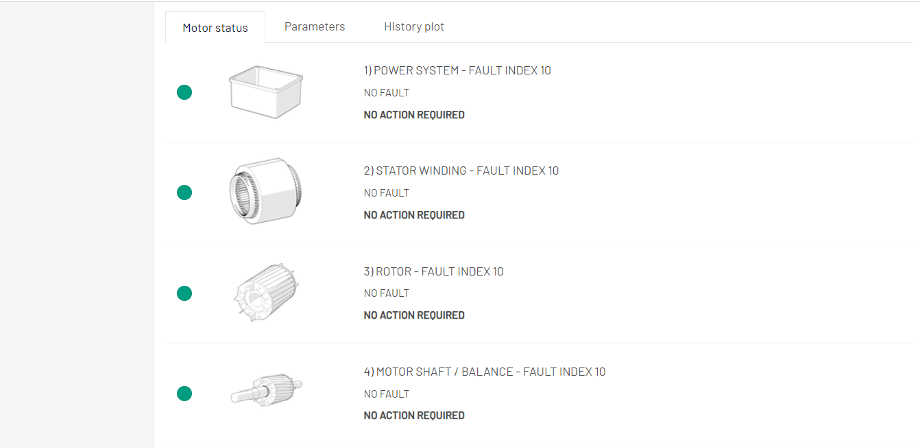
Figure 5 – Detailed motor information
Motor Status tab
The Motor Status tab displays the status of each component of the motor, including a light indicator to the left (green, yellow, or red), and whether or not a fault exists in that component.
Scroll down until you find the component that has failed – red (Figure 6) or the component that might require maintenance soon – yellow (Figure 7).
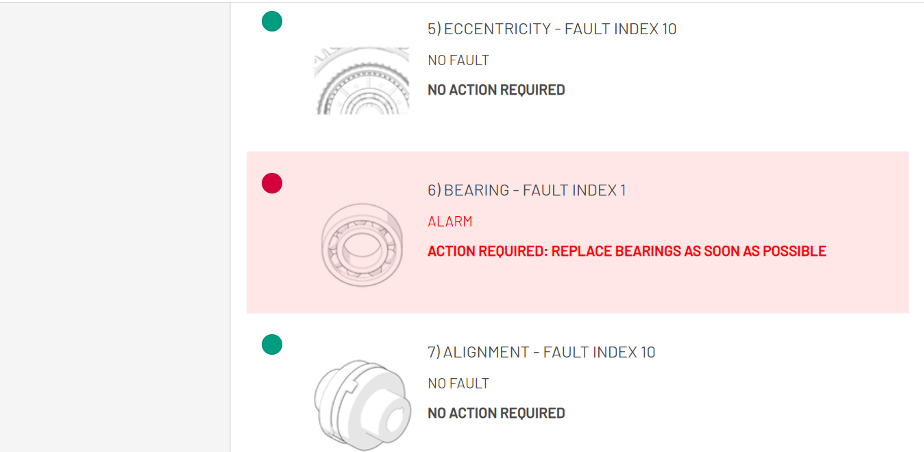
Figure 6. Failed component (red)
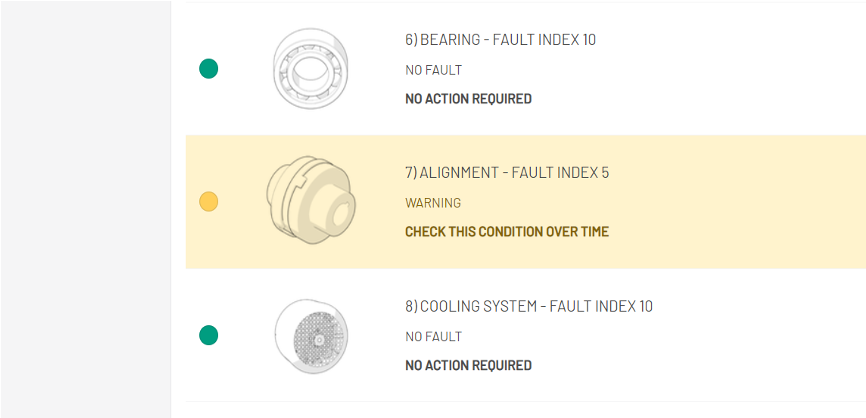
Figure 7. Component might require attention soon (yellow)
Note that the ADI OtoSense application suggests the precise course of action to take in both cases.
Parameters tab
The Parameters tab (Figure 8) offers comprehensive information about the motor, including its tag, model, rated power, and working parameters.

Figure 8 – Parameters tab
The Parameters tab offers additional monitoring options.
The battery icon shows the status of the batteries.
The connection status shows whether the SMS is correctly connected to the cloud.
Click the calendar icon next to Operating Hours and Number of Starts (Figures 9-10) to display a daily, weekly, or monthly range when the motor has been operating or how many times has the motor been started, respectively.

Figure 9 – Creating a date range
Click Apply to display the customized view.
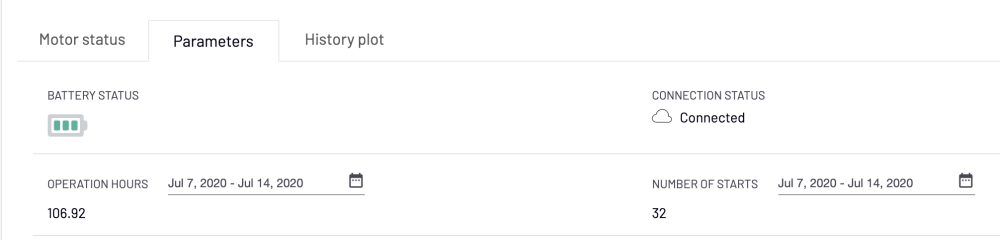
Figure 10 – Operating hours and number of starts
History Plot tab
Maintenance personnel will find it useful to visualize the historical pattern of a particular function (vibration, magnetic fields, etc.) within the motor, to determine whether or not problems might occur.
The History Plot tab includes three sub-tabs (Figure 11a):
- Parameters
- Performance
- Health
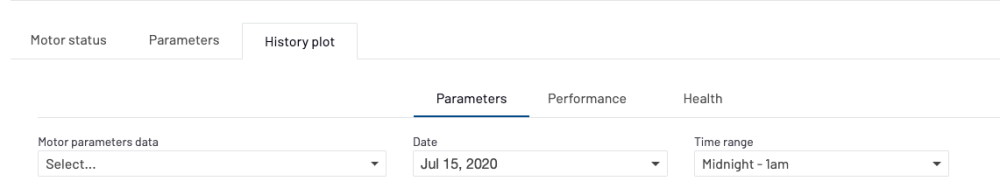
FIgure 11a. History plot sub-tabs
Parameters sub-tab
In this sub-tab, you can plot raw data of vibration in X and Z axes (acceleration [m/s2] and magnetic field in two different ways.
- time domain (sec) (WAVEFORM)
- frequency domain (hertz)(FFT).
SMS collects a sample of 2.5 sec of data every 20 min (the horizontal axis shows these 2.5 sec), so you will find three sets of data to display over a one-hour time range.
You can switch from one sample to the other by clicking on the different times the data was collected, below the horizontal axis.
Select the Motor Parameters Data that you want to check the historical data for and a date and time range. The selected range will be displayed in graphic form (Figure 11b – Parameters sub-tab).

Figure 11b – Parameters sub-tab – plot
Performance sub-tab
In this sub-tab, we can see the RMS (Root Mean Squared) of the raw data for vibration X,Z axes (acceleration [m/s2], velocity [mm/s] and displacement [um]) as well as the magnetic field, and the mean value for speed and temperatures (frame and environment), and this for each set of data acquired every 20 min since the SMS was first activated.
To zoom in on a specific time period, select some dots by click-dragging your mouse over them.
Select one or more motor functions and click Draw Plot (Figure 12a).
Note that you can only select a maximum of four functions to be visualized at any one time.
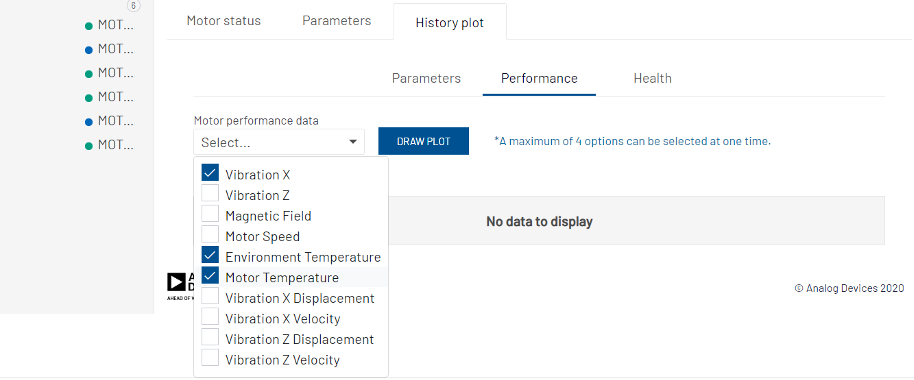
Figure 12a – Performance sub-tab – selection
You will see the plot of the selected functions (Figure 12b)
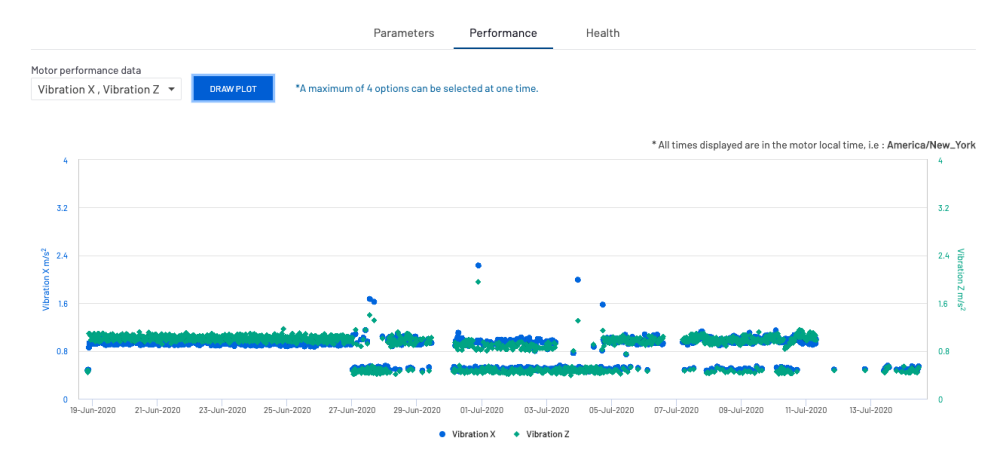
Figure 12b – Performance plot
Health sub-tab
Select one, or all the motor’s components (Figure 13a) to visualize their health and click Draw Plot (Figure 13b).

Figure 13a – Health sub-tab – selection
Each dot represent the health index per each sample data collected every 20 minutes for the chosen component: you can zoom in on a particular date and time by selecting the dots you want to look at more closely (click-drag your mouse on the plot to select these dots).
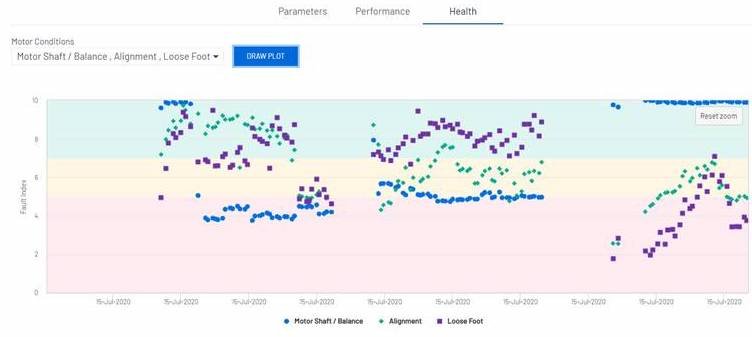
Figure 13b – Health plot