
When the system detects a failure, an email is sent to the user (Fig. 17a)

Figure 17a – Alert email
By clicking on the View Motor link, you will be guided to login page to access the dashboard. Click Alerts in the top bar to view this alert.
The Alerts screen (Figure 17b) displays information about problems that were detected by SMS devices, and the action/s that were performed.
Note that you can sort the view according to several parameters: Motor/Component, Plant/Process, and many others. You can also search for alerts using the Search Bar provided.
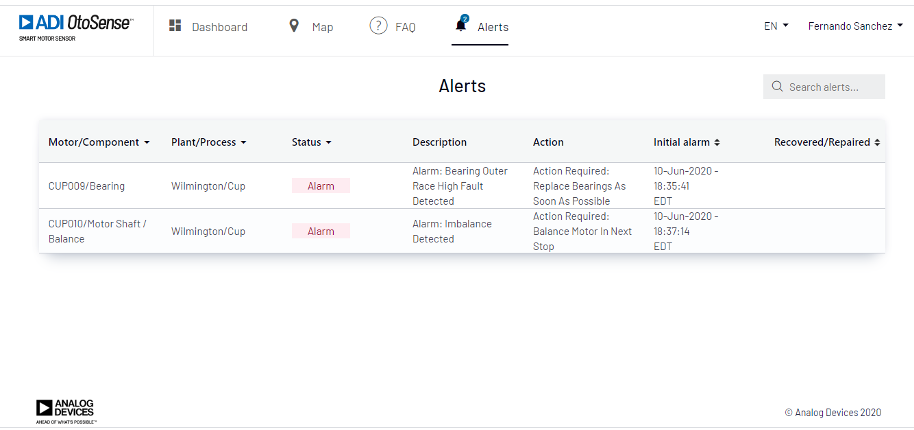
Figure 17b – Alerts view
Clicking on Motor/Component will take you to the component’s plot where you will see the evolution of the component that triggered the alert over time (Figure 17c).
The blue dots represent the fault index for a given sample on a given component.
Index between 0 and 4.9: alarm
Index between 5 and 6.9: warning
Index between 7-10: good condition
You can zoom in by selecting the dots you want to look at more closely (click-drag your mouse over those dots)
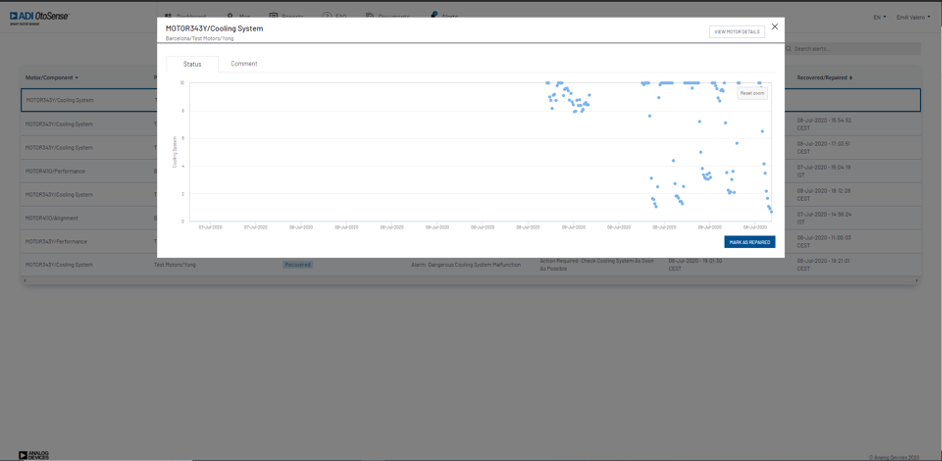
Figure 17c – Component fault condition evolution
Once the motor has been repaired, you can go back to this alert and click Repaired.
You can add some comments about this work by clicking the Comment sub-tab and enter information like “work order”.
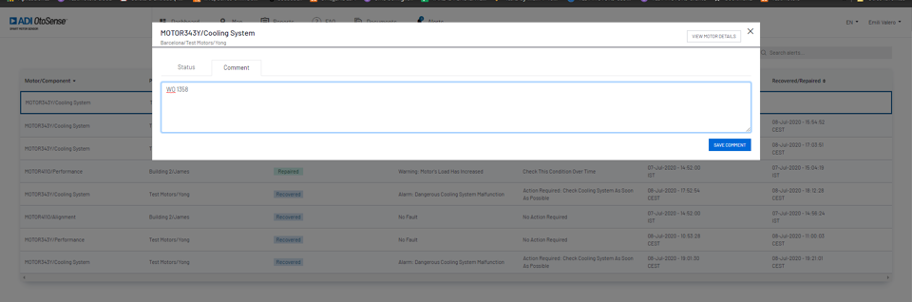
Figure 17d – Alerts – Comment view
Clicking View Motor Details on the top right corner will take you to the exploded motor view that shows what component of the motor triggered the alert.
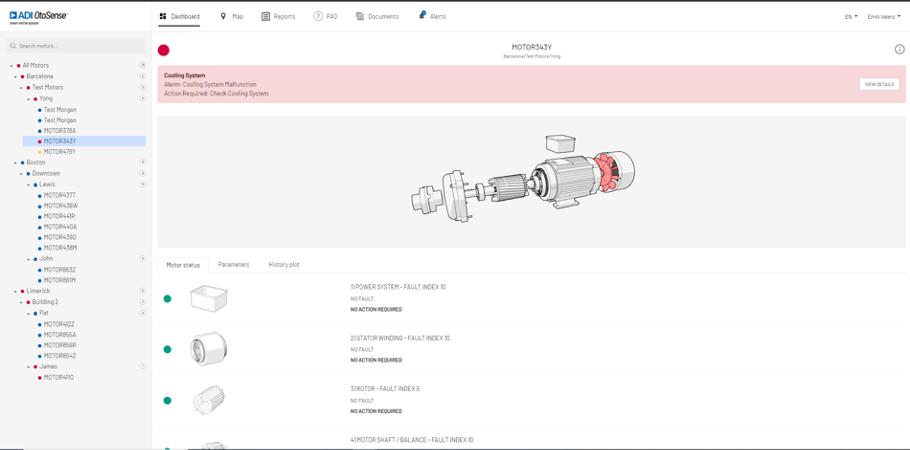
Figure 17e – Motor view with alarm notification
Alarm: indicates what problem the motor is experiencing.
Action required: Indicates how to fix the problem and when. Depending on the severity of the fault (fault index), the timeline of the correction action will change. In case of high severity failure, the actions will be required “as soon as possible” (Fig: 17f)
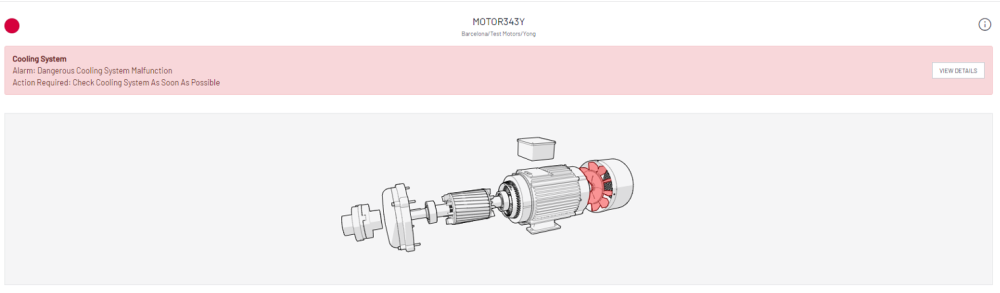
Figure 17f- Motor view with high severity alarm
The motor component under failure will be red colored, yellow in case of warning.
Click on View details on the alarm banner to see the failure mode health plot (Figure 17g).
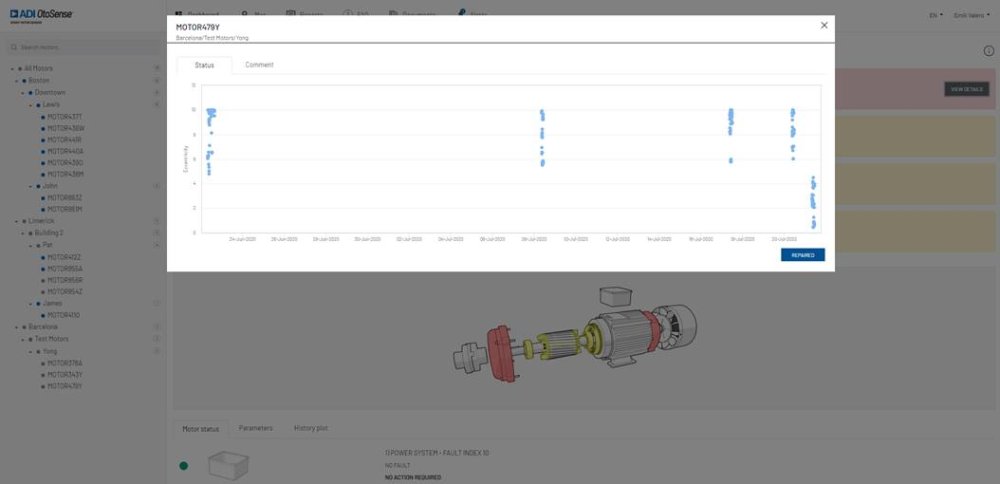
Figure 17g – Failure mode health plot
Blue dots represent the fault index.
Zoom in by click-dragging your mouse over the dots you want to see more closely.
Hovering over each dot opens a text box that displays the index and the date and time of the data acquisition.
Red area – Index between 0 and 4.9: alarm
Yellow area – Index between 5 and 6.9: warning
Green area – Index between 7-10: good condition
How to read the Alerts table
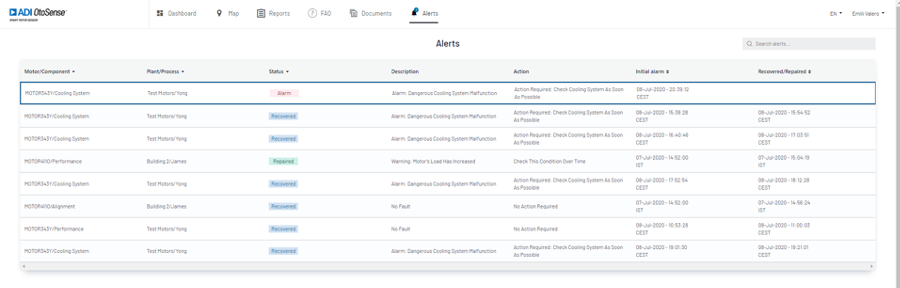
Figure 17h – Alerts: Alarm; Repaired; Recovered; Learning
Alarm
- Shows the “description” of the failure and the “action” to be taken to fix the problem.
- “Initial alarm” date indicates when the alarm was notified.
- If the failure was “Repaired”, the date of the reparation will be shown.
Status “Recovered”
Sometimes the failures are recovered without any reparation associated. The alarm may have been triggered by a sudden change in speed or in the performance and the AI detected that the motor component went back to normal. In these cases, the recovery date are shown in Alerts screen.